 Budget Buddy
See what shapedyour month
See where the month went, how the year is going, and where your balance is heading.
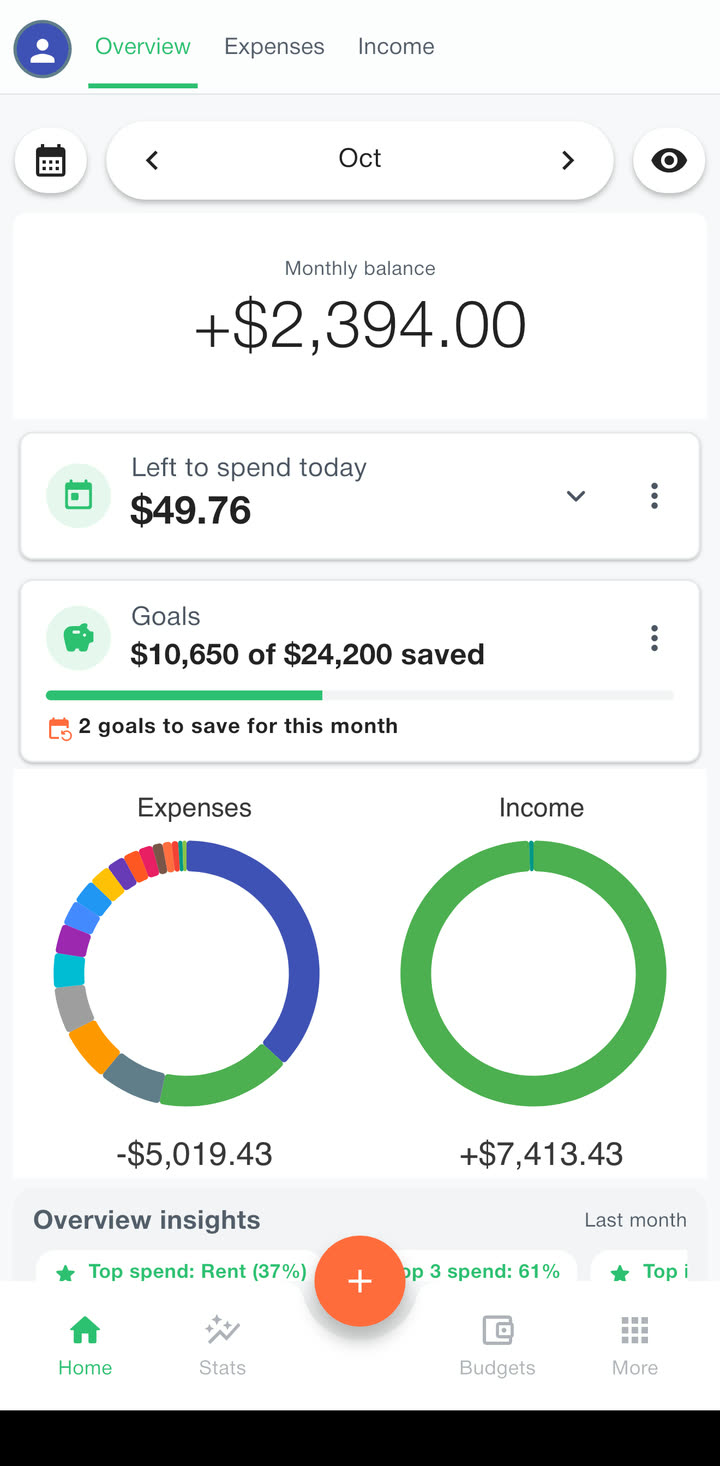
The month on one screen
Open the app and the month is right there: what came in, what went out, and which categories took the most.
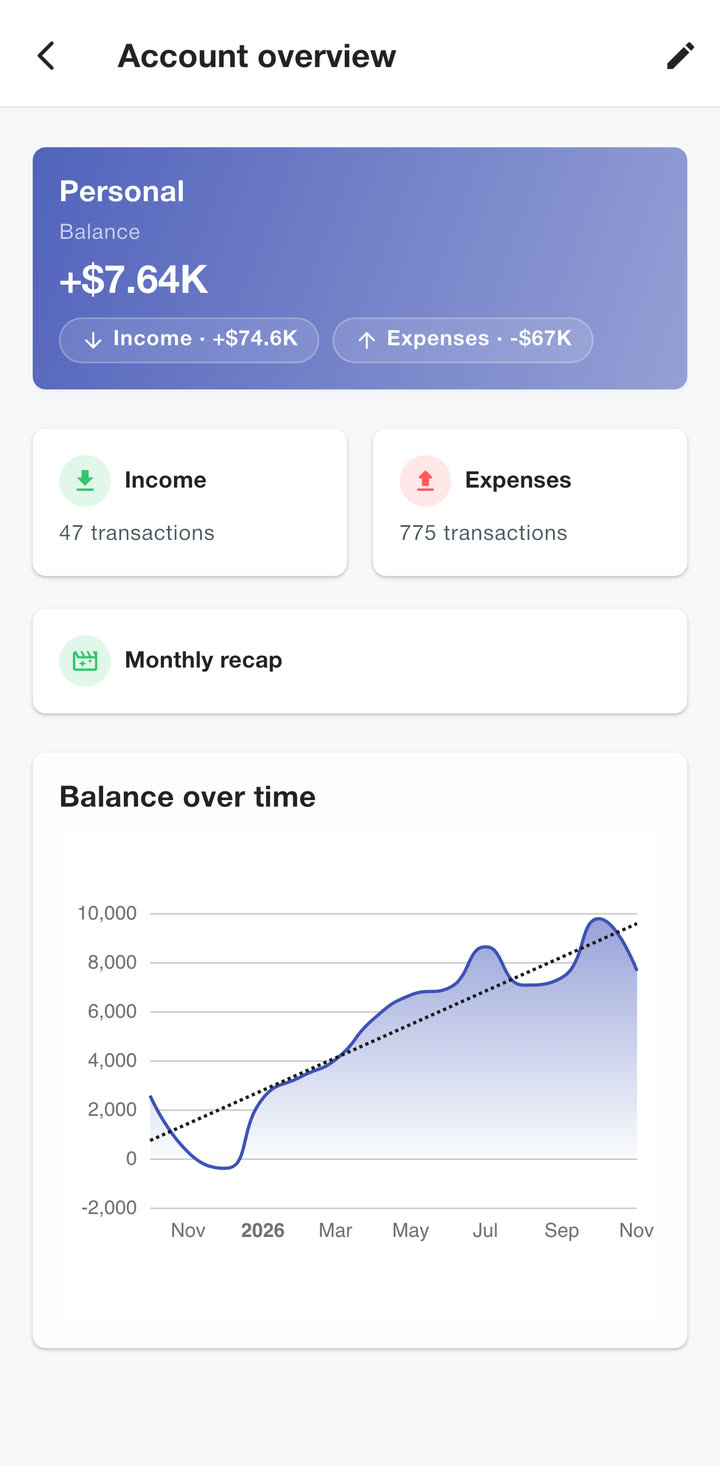
Swipe the balance card to switch between the day, the week, the month and the year, or pick any period from one picker. Each account also has its own overview, with its balance over time.
Charts you can bend
See your spending month by month as bars, lines or areas, and spot the trend before it becomes a habit.
$ 64.18Avg / month
$ 3.67K
$ 2.96K · AprilHighest month
$ 4.34K · August
Plan ahead
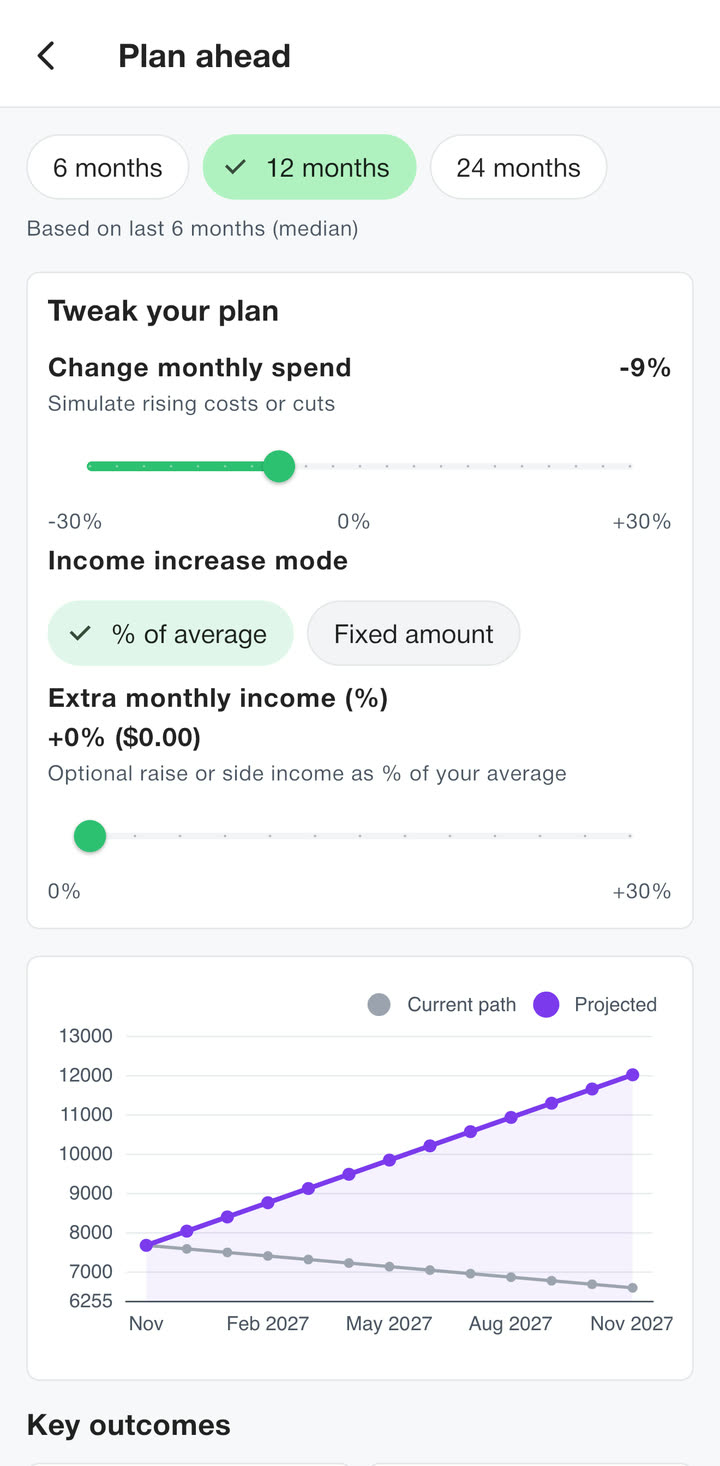
See your balance 6, 12 or 24 months from now, worked out from how you spent over the last six months.
Then try a change. Spend 9% less each month, or add a raise or a side income, and the projected line moves away from your current path.
Net flow
Income against spending, month by month, so you can see which months you saved and which ones got away.
A month below zero shows up straight away, like July and August here.
Net per month
Which day costs most
Find out which day of the week costs you the most, and how much more a weekend day costs than a weekday.
Total by weekday
Smart insights Premium
Short findings above your charts, such as your top spend or a month that is running ahead of the last.
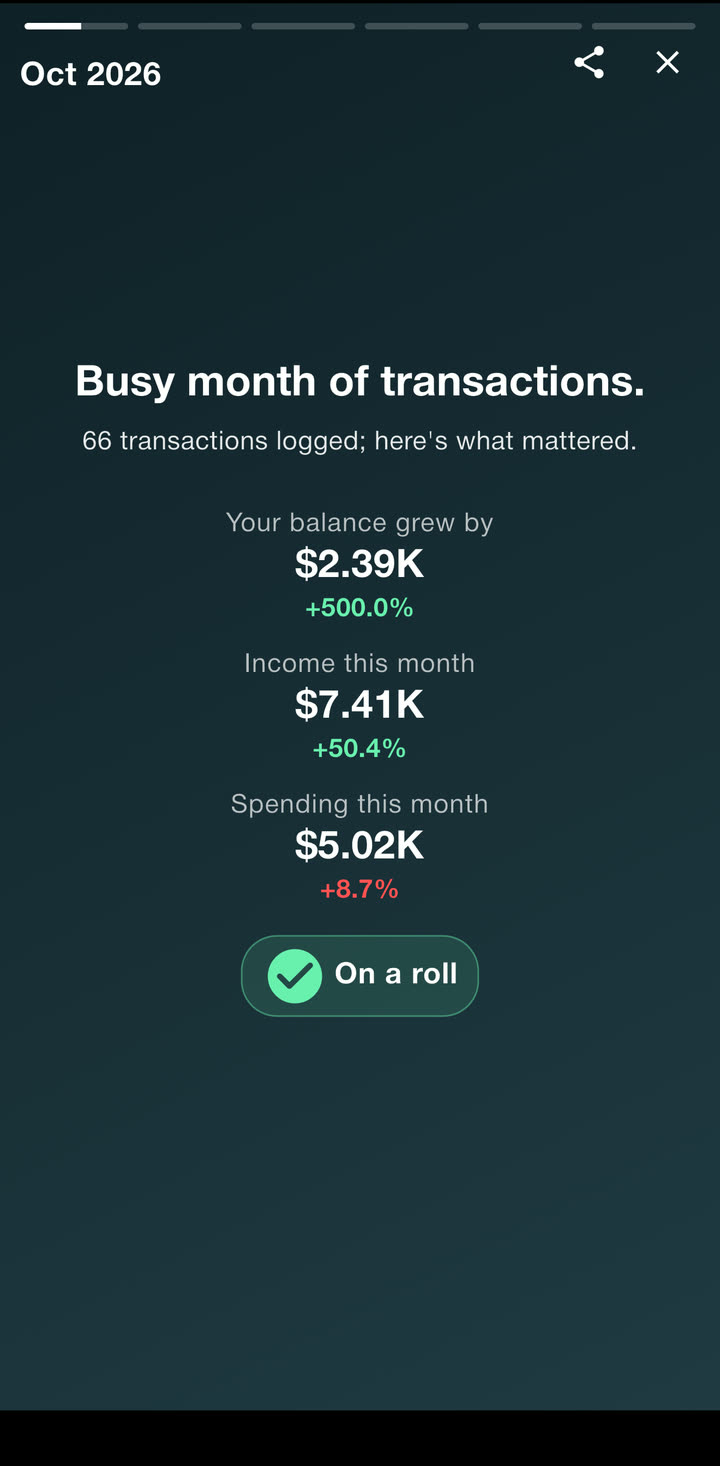
A recap when the month ends
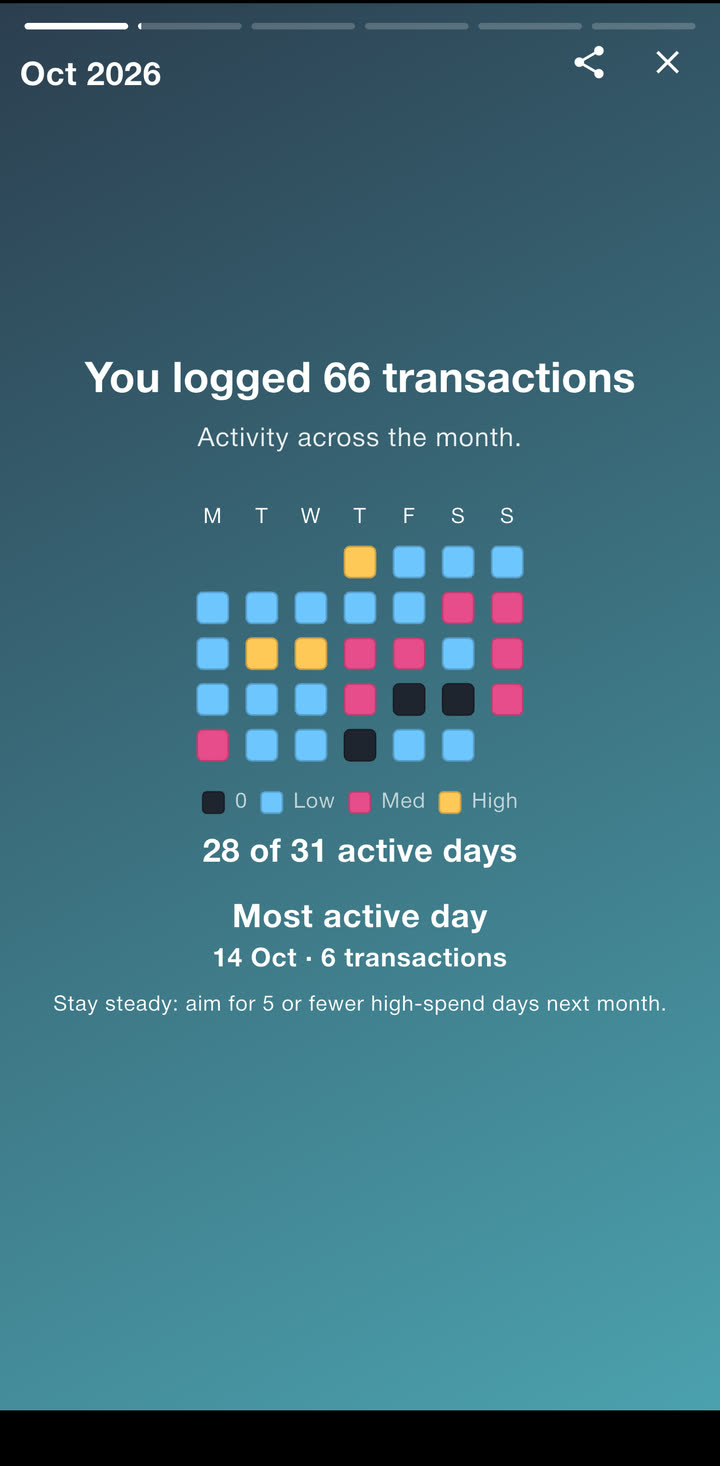
A story you swipe through, opening with a headline about how the month went: “Still in the green.”, “Busy month of transactions.”, or “Spending went overboard.”
Then what moved the most, your best day, your biggest purchase and a calendar of the days you logged something: 28 of 31 in October. Share any slide as an image.
Free on iPhone and Android
No account to make. Install it, pick your currency and log the first purchase.